library(tidyverse)
library(ambient)
library(randomcoloR)
library(ggforce)
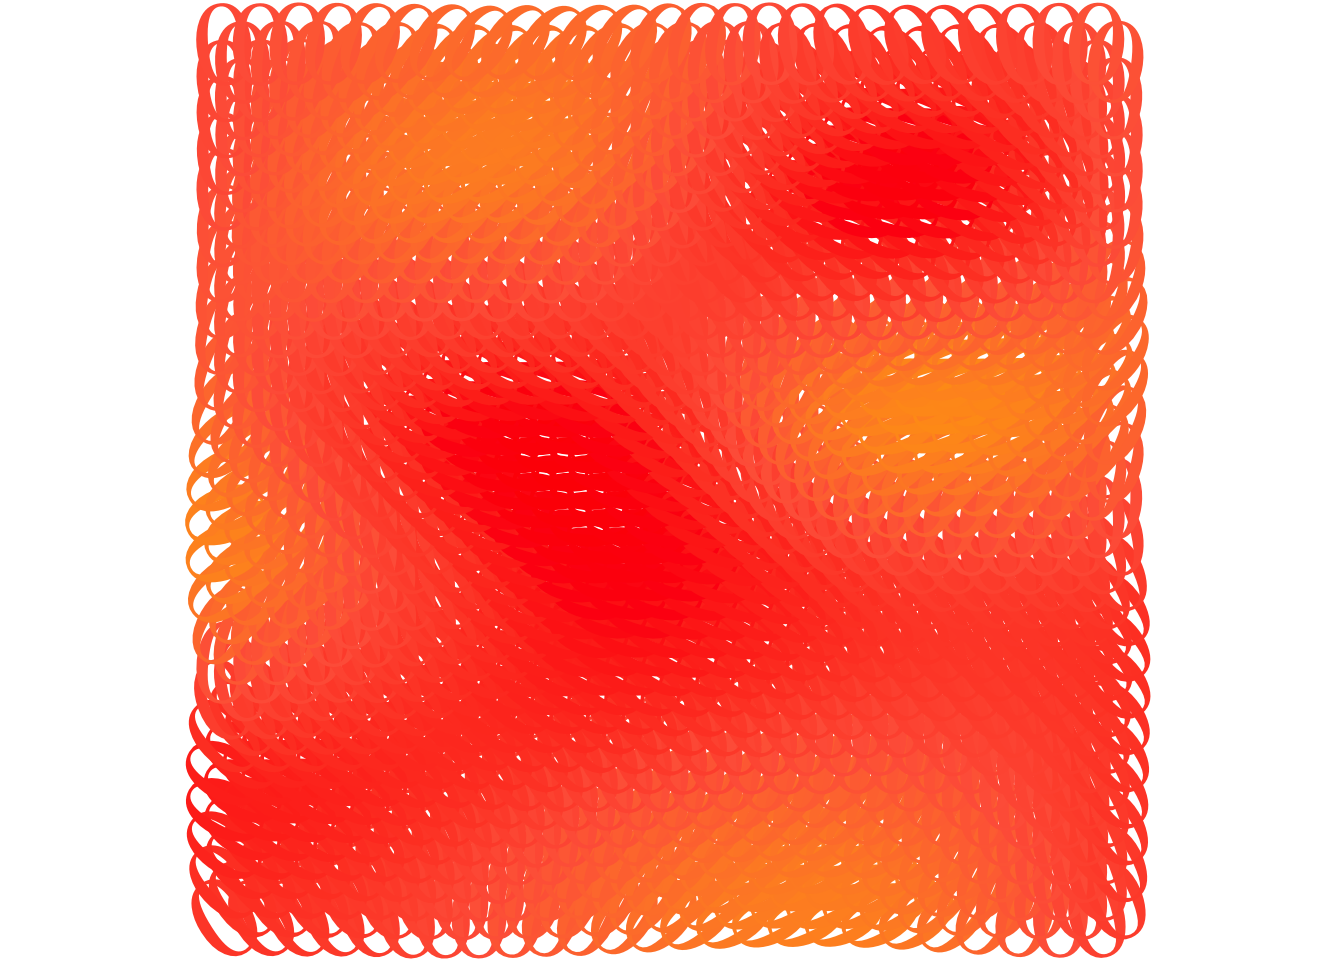
disturbance = expand.grid(c = 1:25, r = 1:49) %>%
mutate(
c = ifelse(r %% 2 == 0, c + 0.5, c),
a = 180 * gen_cubic(c, r, frequency = 0.1, seed = 1964)
) %>%
filter(c <= 50)
ggplot(disturbance) +
geom_text(aes(c, r, label = "0", angle = a, color = a), family = "Times", size = 16, show.legend = F) +
coord_fixed(ratio = 0.5, expand = TRUE) +
scale_color_gradient2(low = "orange", high = "red", mid = "tomato") +
theme_void()
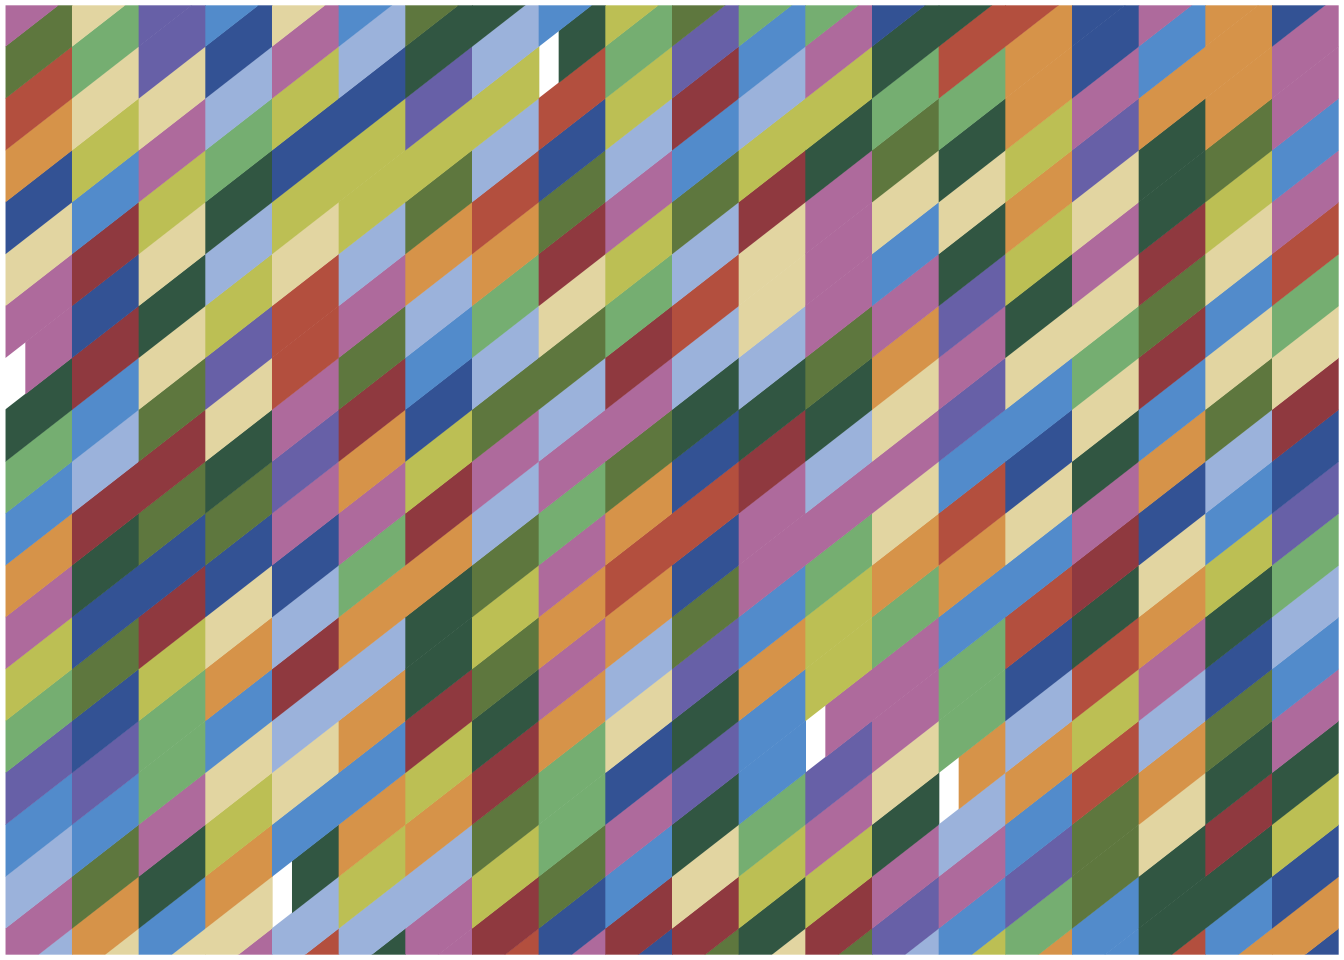
set.seed(1993)

nataraja <- expand.grid(c = 1:20, r = 0:24) %>%
  mutate(
    short = if_else(row_number() %in% sample(1:500, 5), 0.3, 0)
    # long = if_else(row_number() %in% sample(1:500, 5), 0.3, 0)
  ) %>%
  rowwise() %>%
  mutate(
    x = list(c(c + short, c + 1.01, c + 1.01, c + short)),
    y = list(c(r + short, r + 1.01, r + 2.02, r + 1.01 + short)),
    col = round(runif(1, 1, 13), 0)
    ) %>%
  ungroup() %>%
  unnest(c(x, y))


pal <- c(
  "#C2644F", # dark orange
  "#A24D50", # brown
  "#DFA45B", # ochre
  "#E8DCB0", # light ochre
  "#4167A5", # dark blue
  "#639ED5", # light blue
  "#ABC0E2", # very light blue
  "#3F6854", # dark green
  "#70884F", # green
  "#86BA84", # light green
  "#C8C866", # green-yellow
  "#BD81AC", # pink
  "#7B76B6" # purple
  )

ggplot(nataraja) +
  geom_polygon(aes(x = x, y = y, fill = factor(col), group = interaction(c, r)), color = NA) +
  scale_fill_manual(values = pal) +
  coord_cartesian(xlim = c(1, 21), ylim = c(1.5, 19.8), expand = FALSE) +
  theme_void() +
  theme(
    legend.position = "none",
    plot.margin = margin(2, 2, 2, 2)
    )
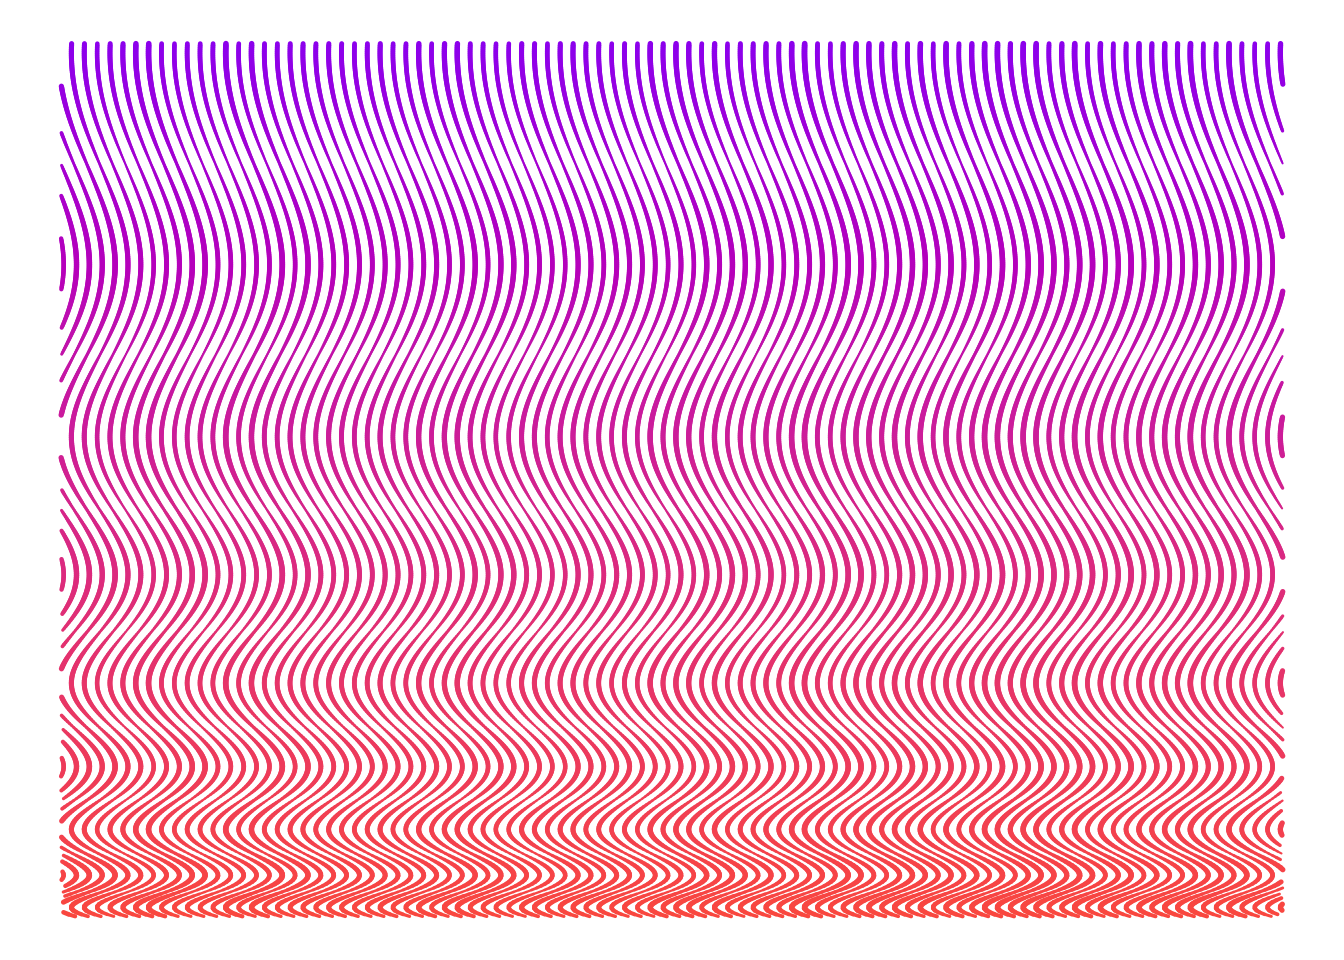
fall <- data.frame(n = 0:105) %>%
  rowwise() %>%
  mutate(
    x = list(seq(2, 45, 0.1)),
    s = runif(1, 0.35, 0.55)
    ) %>%
  ungroup() %>%
  unnest(x) %>%
  mutate(
    y = n + 2.2 * sin(6 * pi * x^(1/4)),
    s = abs(y - n)/5 + s
    )

ggplot(fall) +
  geom_line(aes(x = x, y = y, group = n, size = s, color = x), lineend = "round") +
#  scale_size_continuous(range = c(0.4, 0.8)) +
  scale_size_identity() +
  coord_flip(clip = "off") +
  ylim(5, 100) +
  theme_void() +
  #scale_color_viridis_c() +
  scale_color_gradient2(low = "yellow", high = "purple", mid = "tomato") +
  theme(legend.position = "none")
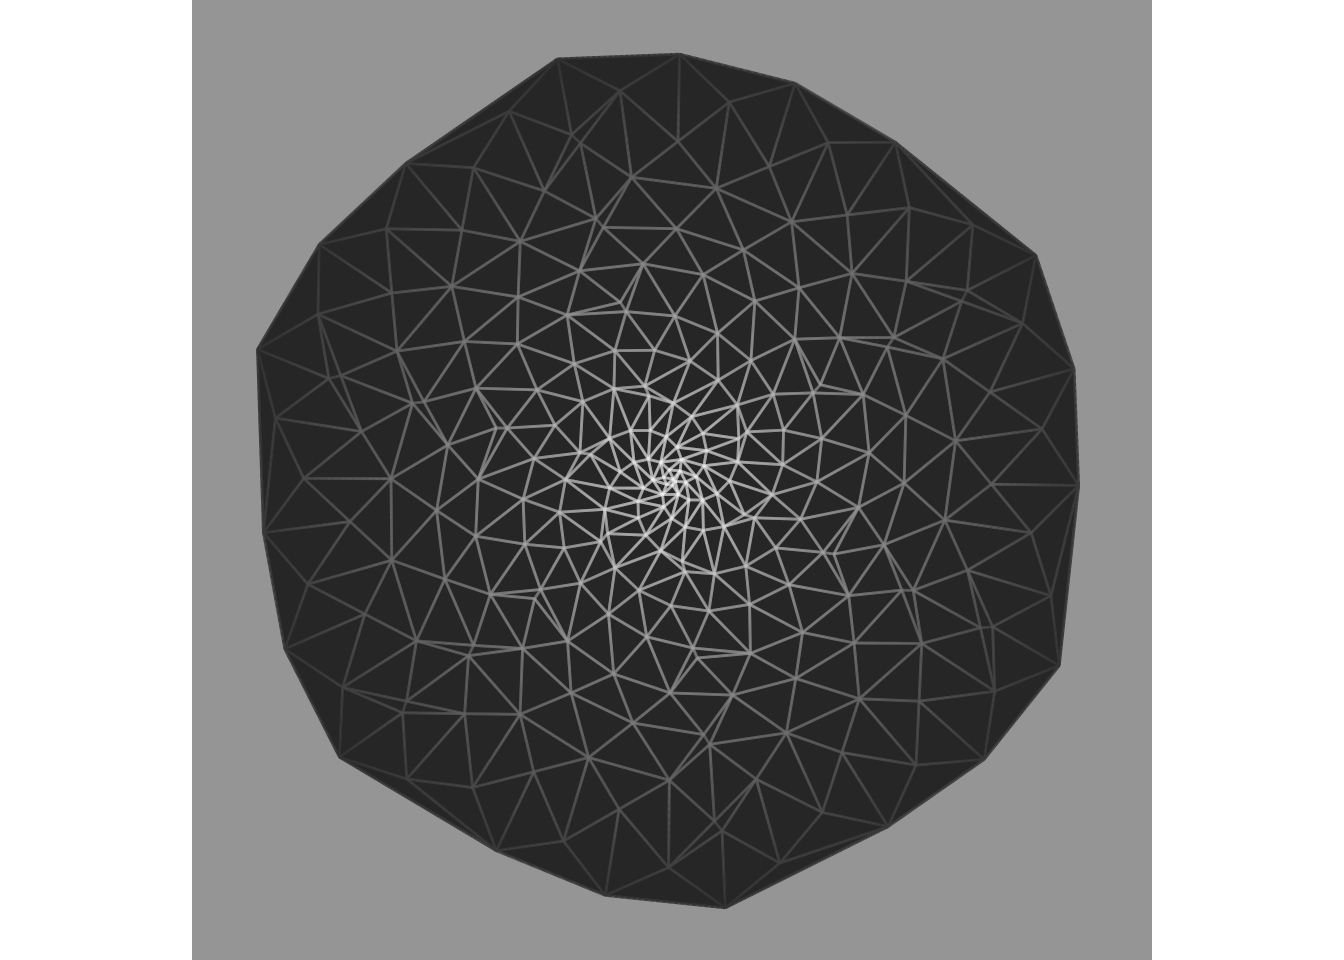
del <- data.frame(x = 1:250 * sin(1:50), y = 1:250 * cos(1:50)) %>%
  mutate(n = row_number())

ggplot(del, aes(x, y)) +
  geom_delaunay_tile(fill = "grey20") +
  geom_delaunay_segment2(aes(color = -n)) +
  scale_color_gradient(low = "grey25", high = "white") +
  coord_fixed() +
  xlim(-250, 250) +
  ylim(-250, 250) +
  theme_void() +
  theme(
    legend.position = "none",
    plot.background = element_rect(fill = "grey65", color = NA)
  )